By Steven Ralston, CFA
NYSE:UHAL
READ THE FULL UHAL RESEARCH REPORT
EXECUTIVE SUMMARY
U-Haul Holding Company (NYSE:UHAL) reported 1Q FY2026 results on August 6th after the close. Revenues were above expectations; however, the bottom line was impacted by higher depreciation expense ($87.5 million higher in 1Q FY2026 than in 1Q FY2025 which impacted EPS by $0.21) as well as retired pickups and cargo vans being sold at lower resale values (which affected 1Q 2026 EPS by $0.12).
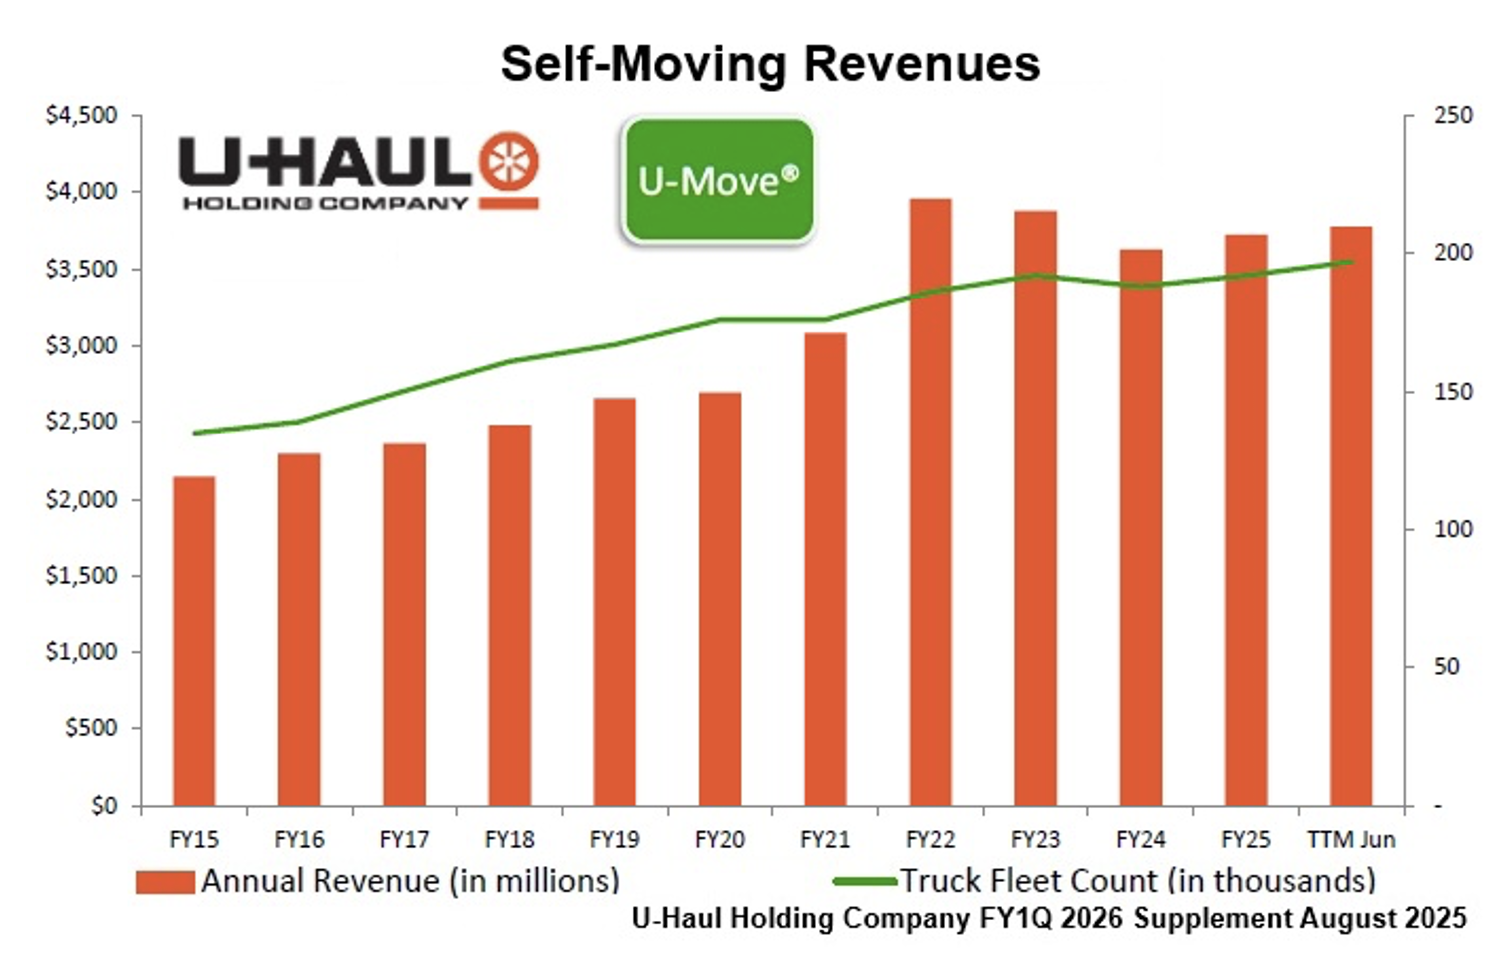
In the self-moving equipment rental business, management expects continued modest top-line growth, which started over a year ago in 1Q FY2025. There are signs of customer optimism as well as the willingness to accept slight rate increases. The revenue trend in July 2025 continues to exhibit positive YOY comparisons. Management will continue to focus on increasing transaction volume and equipment utilization, along with improving pricing.
The continual investment of capital and resources in the self-moving segment, self-storage and the U-Box program is an important component of the company’s overall operational strategy though the spend on new box trucks should slow next year. In the self-storage area, management continues to open new locations and expand select existing locations, but in a more measured way with the initial opportunities already having been exploited.
U-Box remains a higher growth area with transactions in both self-moving and storage categories. Though the financial results of U-Box are reported in the “Other revenue” line item, it is obvious that U-Box is growing at a faster rate than the self-moving equipment segment. In the first quarter of fiscal 2026, U-Box’s revenue returned to a double-digit growth rate (15.6%), after several quarters at mid-to-high single-digit top line growth.
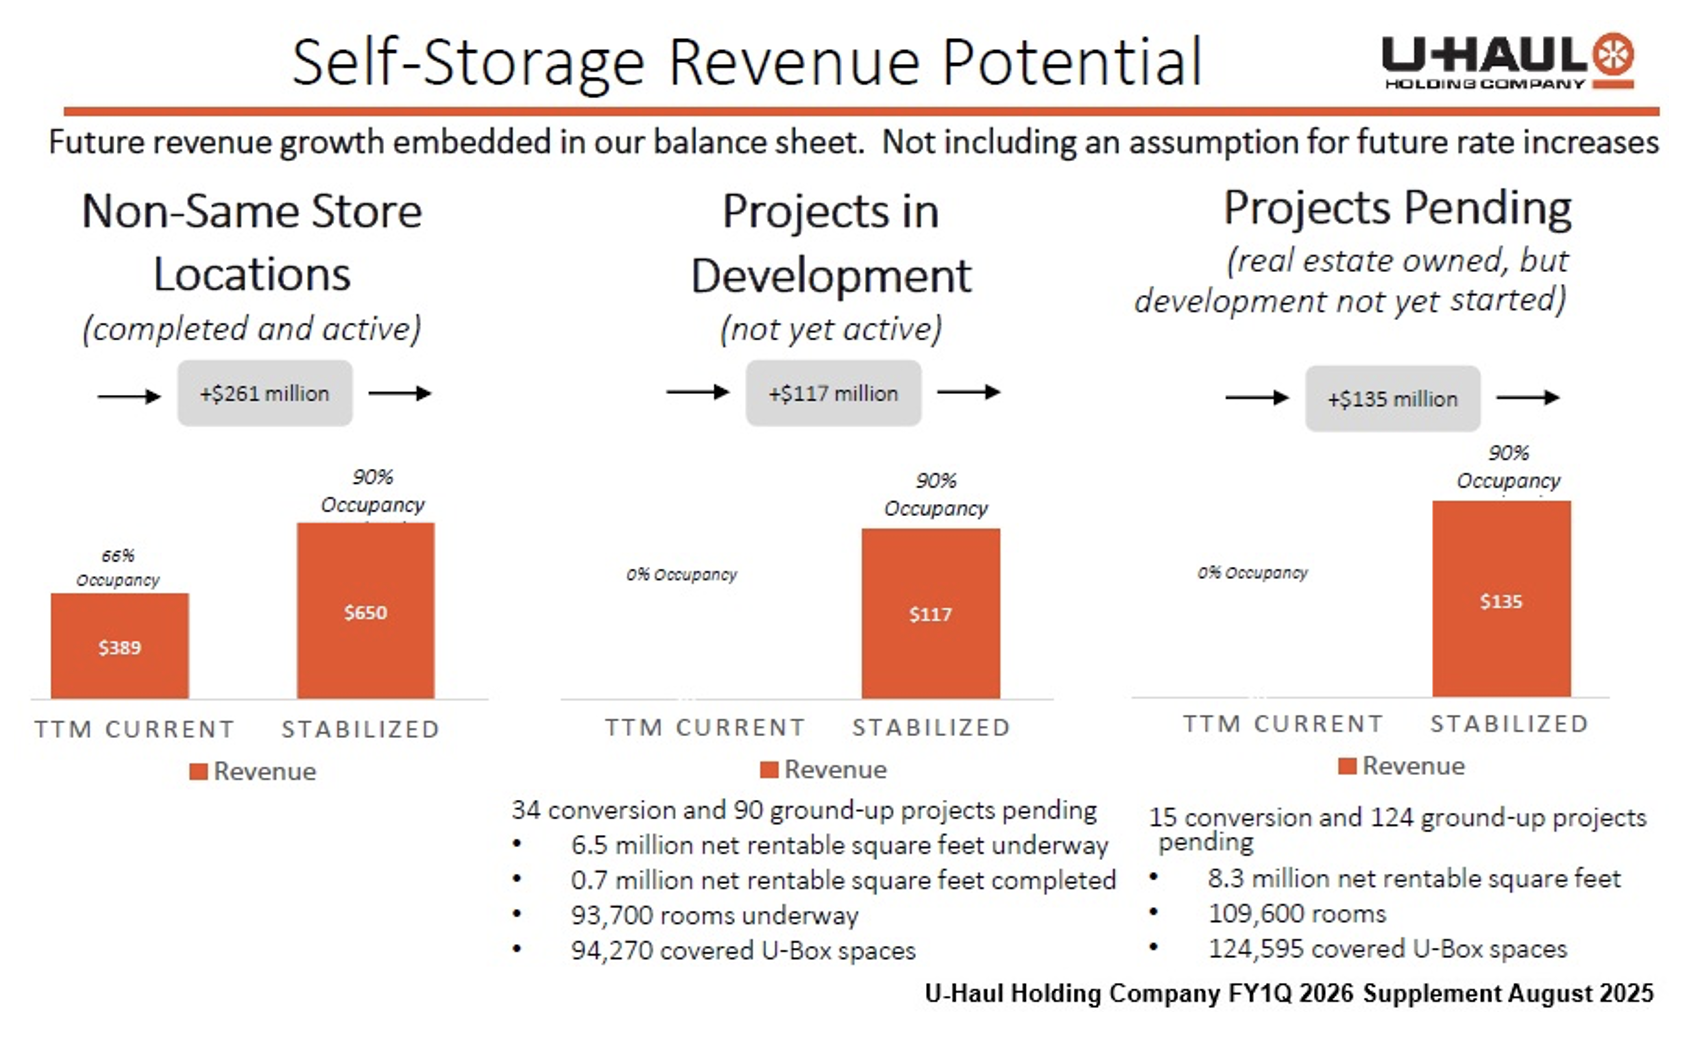
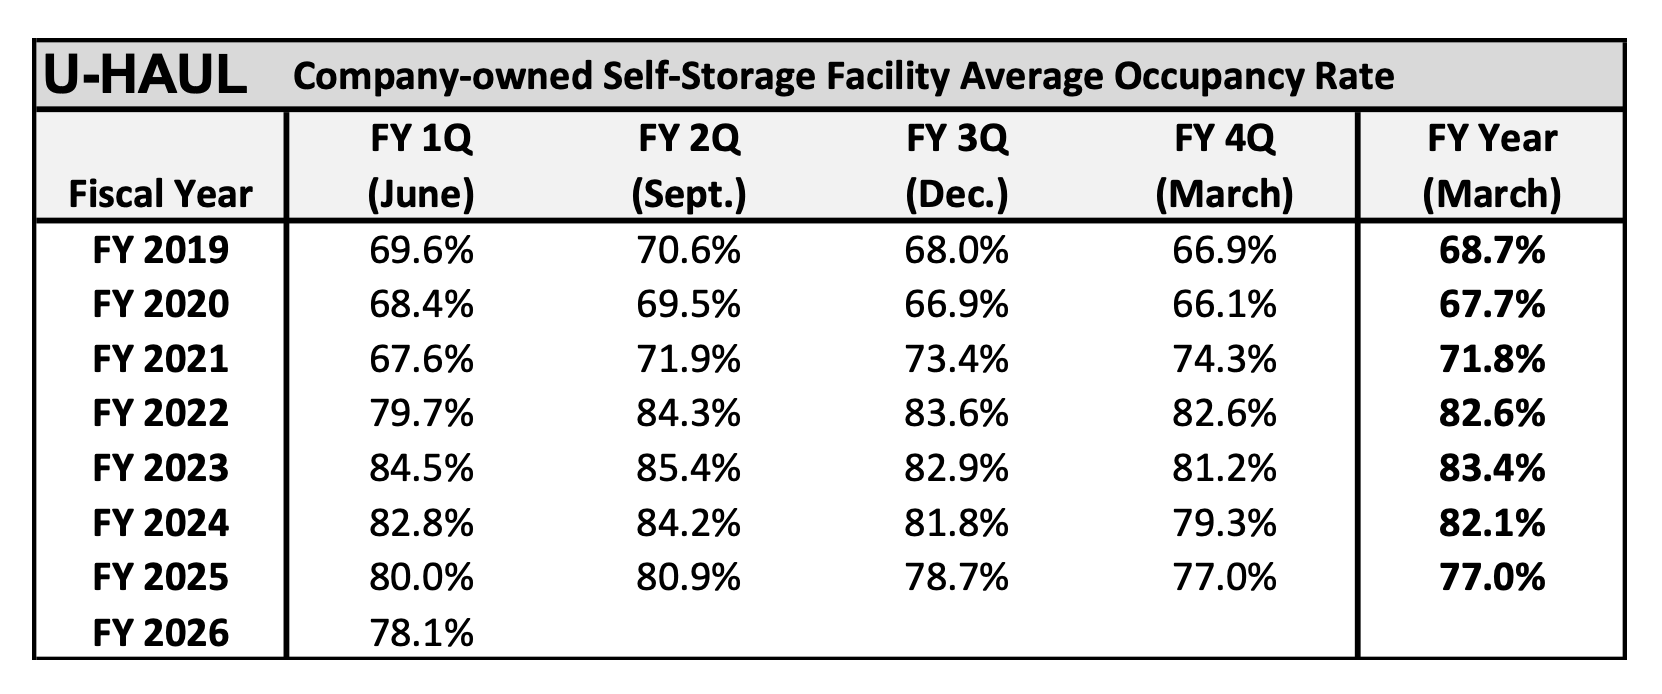
Revenue of the self-storage increased 8.6% (or $18.5 million) to $234.2 million in1Q FY2026. Though same-store occupancy declined 1.0 percentage point to 92.8%, revenue per foot increased 0.6%. The company added approximately 1.2 million net rentable square feet at 15 new storage locations during the quarter. Around 14.8 million net rentable square feet are in development or pending completion with another 8.3 million square feet (106,000 rooms and 124,595 covered U-Box spaces) in the pipeline.
Management added a slide in the quarterly supplemental investor deck (see directly below) that illustrates the magnitude of expected future storage revenue growth from the existing portfolio, projects in development and pending projects once they have stabilized.
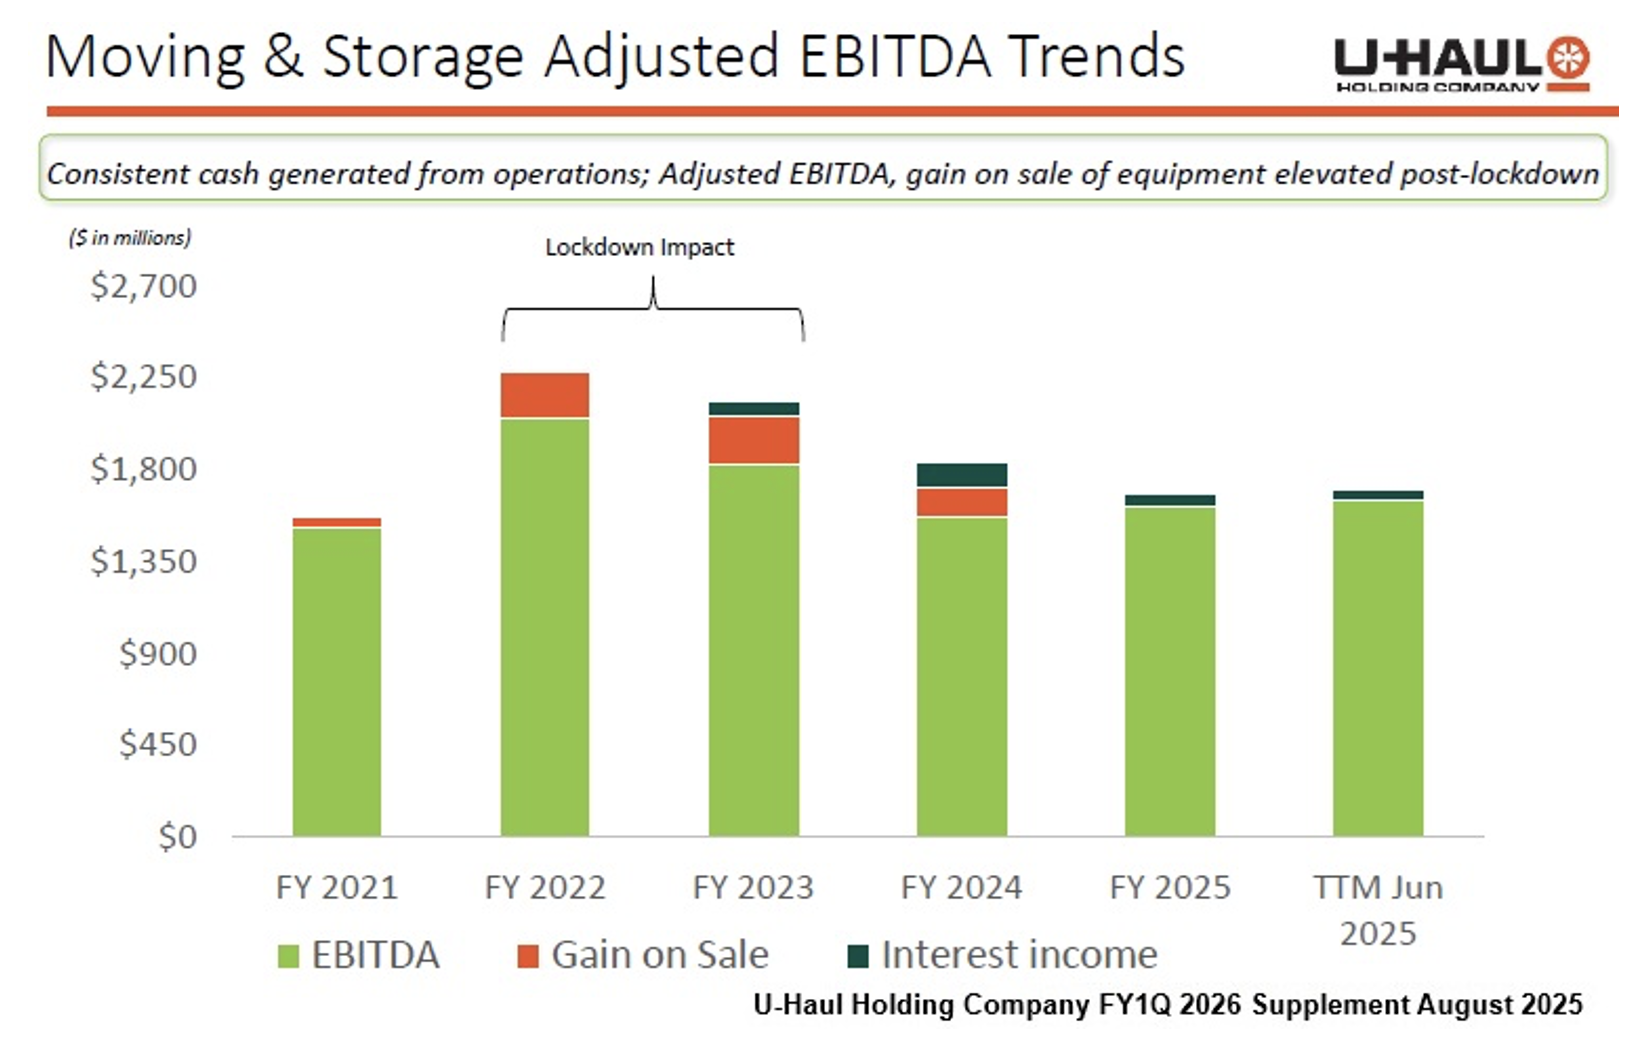
An adjusted EBITDA slide in the company’s quarterly supplemental investor deck demonstrates that the company benefited significantly from the sale of moving equipment in the three fiscal years after the COVID-19 lockdown as well as from the higher short-term interest rate when the rate of inflation spiked up to 8.0% in 2022, which positively affected interest income in FY2023 and FY2024.
U-Haul will host its 19th Annual Virtual Analyst and Investor meeting on Thursday, August 21, 2025 at 2 PM ET.
Financial Results for First Quarter of Fiscal 2026
On August 6, 2025 after the market close, U-Haul Holding Company reported financial results for the first fiscal quarter ending June 30, 2025. Total revenues increased 5.3% (or $82.0 million) to approximately $1.63 billion, which was above expectations as the company achieved highest level of total revenues for the first fiscal quarter in the company’s history.
The segment drivers of the revenue increase were a 4.3% increase (or $43.9 million) in the self-moving equipment rental revenue, an 8.6% increase (or $18.5 million) in the self-storage business and a 15.6% increase (or $20.8 million) in “Other revenue,” which is primarily driven by moving and storage transactions related to U-Box.
In the self-moving equipment rental business, revenues increased 4.3% (or $43.9 million) as the average revenue per transaction improved for both In-Town and One-Way move markets.
In the self-storage area, revenues increased 8.6% (or $18.5 million) as the average monthly number of company-owned occupied units increased by 6.4% YOY (or roughly 38,000 units). Self-storage revenues increased due to a 1.3% increase in average revenue per occupied square foot and an increase in new capacity (1.2 million net rentable square feet over 31,582 units) during the quarter.
In self-moving/self-storage products & services, revenue increased 1.7% (or $1.6 million) due to increased sales of hitches and moving supplies.
Other revenue increased by 15.6% (or $20.8 million), primarily due to higher sales in the U-Box program due to the continued expansion of the breadth and reach of the U-Box program through the addition of warehouse space, moving & storage containers and delivery equipment.
Total Operating costs and expenses increased by 10.5% (or $130.8 million). Operating expenses increased 4.7% (or $37.0 million), primarily driven by personnel costs (an increase of $20.2 million), liability costs (an increase of $17.2 million) and fleet repair expenses (an increase of $5.2 million).
Depreciation expense (net of disposals) increased 40.4% (or $87.5 million) to $304.0 million as rental fleet depreciation increased $50.7 million due to an increased pace of new additions to the fleet and depreciation expense from real estate increased $7.1 million. As management traditionally has reinvested for growth through capital expenditures, depreciation has temporarily masked the company’s earnings power.
Management continues to return to a normalized rotation program. Capital expenditures on new rental box trucks, trailers, towing devices and cargo vans totaled $585 million during the first fiscal quarter compared to $539 million comparable quarter last year.
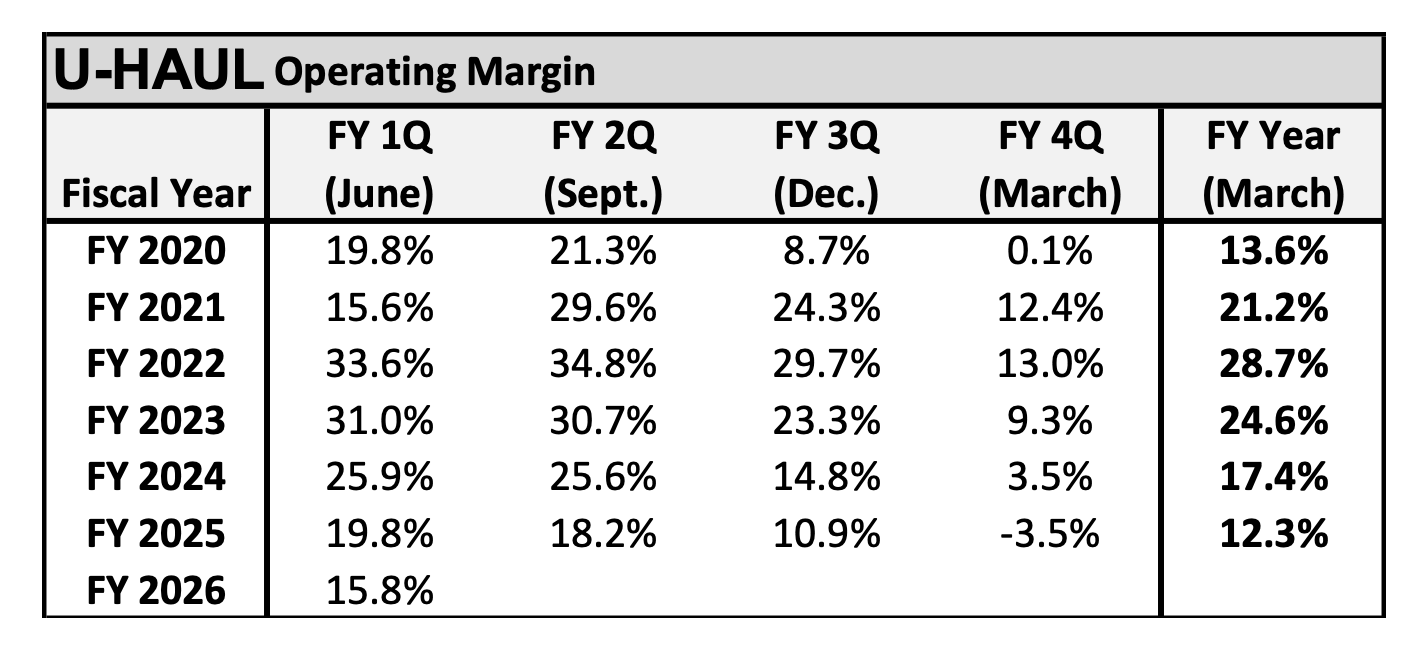
Earnings from operations declined 15.9% (or by $48.8 million) to $257 million compared to $306 million in first quarter of fiscal 2025. Despite the stronger than expected Revenues in the self-moving and self-storage areas, which drove a 5.3% revenue increase YOY, Total Operating Expenses increased 10.5%, resulting a 399 bps decline in the operating margin, which accounts for the reduced earnings from operations. The two major sources of increased operating expenses were depreciation and the operating expenses attributed to self-moving equipment and self-storage.
Interest expense increased 22.5% (or $15.1 million) to $82.3 million.
For the first quarter of fiscal 2026, U-Haul Holding Company reported a net income of $142.3 million (or $.68 per diluted Voting Share), a 28.5% decrease compared to $195.4 million (or $0.95 per diluted Voting Share) in the comparable quarter last year. Shares outstanding have remained stable at 19,607,788 shares since fiscal 2020.
Note: Management utilizes the two-class method where distributed earnings (dividends) and undistributed earnings are allocated in a three-step process to each class of common stock.
As of June 30, 2025, U-Haul Holding Company has a strong liquidity position. The Moving and Storage operating segment has approximately $1.19 billion of cash and available credit. Working capital was approximately $4.36 billion on June 30, 2025.
Valuation
U-HAUL operates in both the “do-it-yourself” consumer truck and trailer rental business and in the self-storage industry. The vehicle rental business requires considerable investment in infrastructure (rental facilities and vehicles). Earnings in this segment tend to exhibit cyclicality, which is a consequence of the substantial earnings leverage that can be derived from improved utilization of the fleet. On the other hand, despite also requiring a significant investment in infrastructure (storage buildings), self-storage operations tend to be much less cyclical and provide steady cash flow.
From an investment perspective, both types of operations are generally valued on the metric of EV-to-EBITDA (Enterprise Value-to-Earnings Before Interest, Taxes, Depreciation and Amortization). From the Industry Comparable table below, it is observable that self-storage operations are valued at a higher EV-to-EBITDA basis due to each industry’s fundamental attributes described above. Due to the small sample size of public truck rental companies (since Penske and Enterprise are not publicly traded) and due to recent price rally of Avis Budget, the EV-to-EBITDA metric is distorted.
By expecting the high EV-to-EBITDA valuation metric to be 10.9 at some point during the next 12 months, a target price of $70.47 is indicated.
SUBSCRIBE TO ZACKS SMALL CAP RESEARCH to receive our articles and reports emailed directly to you each morning. Please visit our website for additional information on Zacks SCR.
DISCLOSURE: Zacks SCR has received compensation from the issuer directly, from an investment manager, or from an investor relations consulting firm, engaged by the issuer, for providing research coverage for a period of no less than one year. Research articles, as seen here, are part of the service Zacks SCR provides and Zacks SCR receives payments totaling a maximum fee of up to $50,000 annually for these services provided to or regarding the issuer. Full Disclaimer HERE.