By Steven Ralston, CFA
NYSE: UHAL
READ THE FULL UHAL RESEARCH REPORT
EXECUTIVE SUMMARY
U-Haul Holding Company (NYSE: UHAL, UHAL.B) reported 1Q FY2027 financial results on August 5th after the close. The company delivered record-breaking first-quarter total revenues for the first fiscal quarter, historically the company’s second-strongest seasonal quarter. Total revenues increased 3.2% (or $51.6 million). Top-line growth was achieved across all major business segments. The primary driver was the self-storage business, which increased 6.8% due to a 6.2% improvement in average revenue per occupied square foot. Self-moving equipment rental revenues rose 2.8%, driven by increased transactions and revenue across both In-Town and One-Way markets. Other revenue, predominantly driven by U-Box transactions, saw a modest increase of 1.1%.
Despite record top-line performance for a first fiscal quarter, the bottom line was pressured by a 4.3% increase in total costs and expenses, primarily a $22.4 million increase in freight & shipping costs, a $10.2 million increase in personnel costs, and a $6.2 million increase in self-insured liability costs. Consequently, the company’s operating margin declined by 89 basis points to 14.9%. Earnings from operations decreased 2.6%, and net income declined 13.6%. Earnings per share of Voting common stock were $0.58 per share versus $0.68 in the comparable quarter last year.
Fleet depreciation declined 1.7%, representing the third consecutive quarterly decline. Net losses from the disposal of retired rental equipment decreased by $24.0 million. Due to the expansion of the rental fleet to a sufficient operational capacity, management is not planning on growing the truck fleet in fiscal 2027. Accordingly, management projects a reduction of over $500 million in net fleet investment during the remaining three quarters of the fiscal 2027 year.
U-Haul maintains a strong liquidity position, holding approximately $1.348 billion in cash and available credit facilities within the Moving and Storage segment, and maintaining working capital above the $4.0 billion level. Given the company’s solid financial footing, on May 22, 2026, the Board authorized a $350 million share repurchase plan targeting both UHAL and UHAL.B share classes. The program is being partially funded by the planned reduction in growth capital expenditures. During the first fiscal quarter, the company deployed $48 million to buy back 248,368 Voting shares and 584,278 Non-Voting shares. As of August 2026, the remaining authorization for future repurchases is roughly $242 million.
On August 20, 2026, U-Haul held its 20th Annual Virtual Analyst and Investor Meeting, which was largely composed of answering analyst and investor questions.
Highlights from the 20th Annual Virtual Analyst & Investor Meeting
Independent Dealer Network Expansion Strategy: Management plans to add 3,000 new dealers, using electronic tools and local field managers to identify both growth areas and recruit partners based on business quality, community integration, and ability to provide consistent service and convenience. Currently, U-Haul has roughly 23,000 independent dealers who are paid an average 21% commission across all product lines.
Toy Hauler: The Toy Hauler rollout has exceeded expectations by generating incremental transactions by addressing the needs of new customer segments, specifically the off-road and overlanding markets.
U-Box: U-Box container occupancy is at 67%, with warehouse utilization at 34%. Since the company’s warehouse infrastructure footprints have been built out beyond current demand levels, management has paused new warehouse expansion in order to focus on investing in additional containers. Management affirmed that U-Box and self-storage are positioned as complementary offerings, with U-Box serving customers with temporary and portable needs, while self-storage caters to customers that desire recurring convenient access over a generally longer period of time. Recently, freight and fuel surcharges charged by freight companies have compressed margins at U-Box.
Capital Allocation: Net leverage has doubled to 4.4x net debt-to-EBITDA over the last four years, exceeding management’s target comfort zone between 3.5x and 4.0x. In response, management has reduced projected real estate spending for self-storage, shifted the fleet rotation plan to a replacement/maintenance only phase for self-moving equipment and instituted a share repurchase program, the latter of which has been viewed very positively by investors. The focus in FY2027 is on asset utilization. Jason Berg, CFO, noted that by increasing revenue via higher asset utilization , the EBITDA margin could return to the 10-year average of 33%, though the timetable is unclear.
Operating Leverage: U-Haul has and is increasing capacity to serve both the self-moving and self-storage markets. During a normalized period of time with an average utilization rate, management estimates that the self-moving segment, could generate an additional $330 million in incremental revenue while another $288 million-to-$290 million in revenue is possible on the self-storage side.
FINANCIAL RESULTS 1Q FY2027
On August 5, 2026, after the market close, U-Haul Holding Company reported financial results for the first quarter of fiscal 2027 ending June 30, 2026. Total revenues increased 3.2% (or $51.6 million) to approximately $1.682 billion, another record for the first fiscal quarter in the company's history. Self-moving equipment rental revenue increased 2.8%; the self-storage business increased 6.8% and Other revenue, which is primarily driven by moving and storage transactions related to U-Box modestly increased 1.1%.
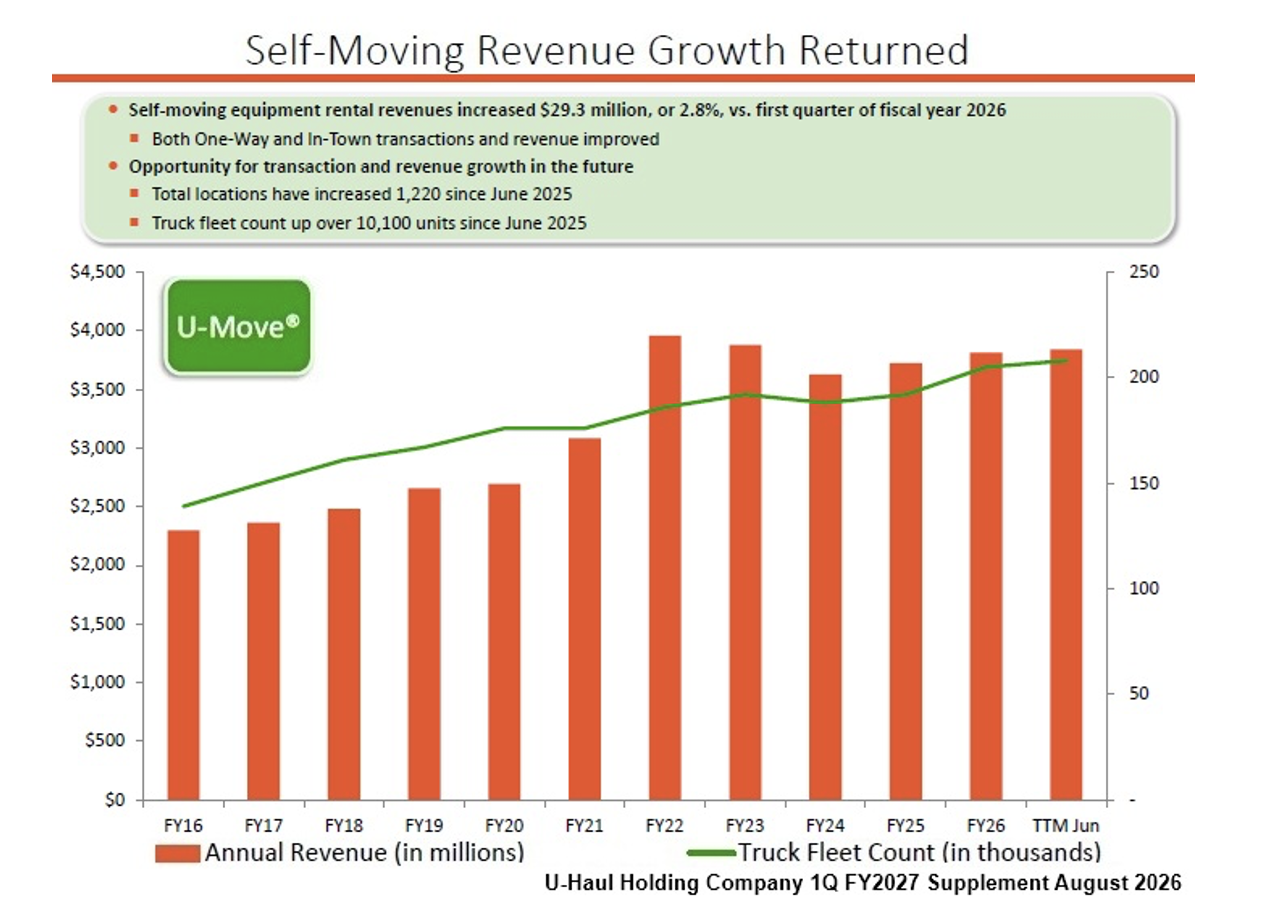
In the self-moving equipment rental business, revenues increased by 2.8% (or $29.3 million) as transactions and revenue increased across both the In-Town and One-Way markets, aided by the addition of company-operated retail locations, independent dealers and additional box trucks compared with the same period last year. In-Town revenue increased approximately 2%, while transactions increased roughly 0.5%. One-Way revenue per transaction declined slightly, though miles per transaction experienced a modest increase reversing a recent period of minor declines.
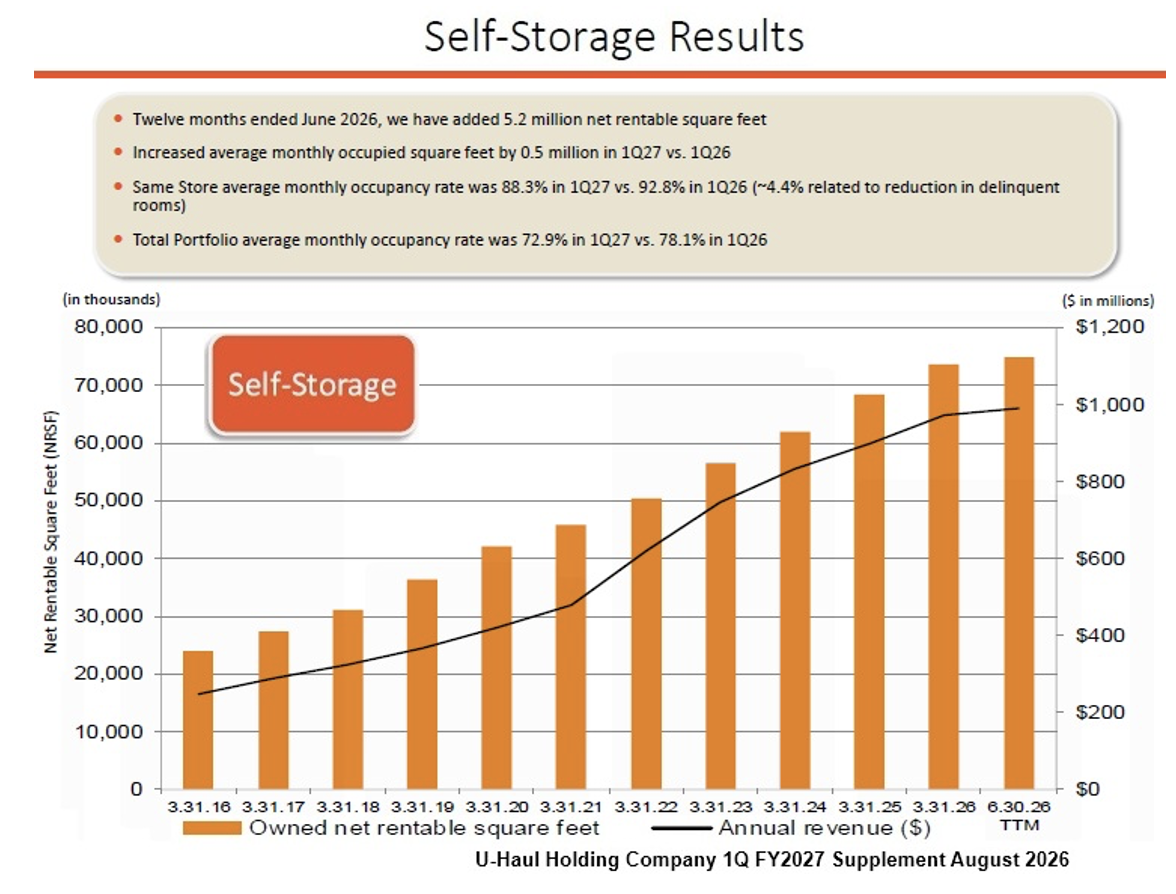
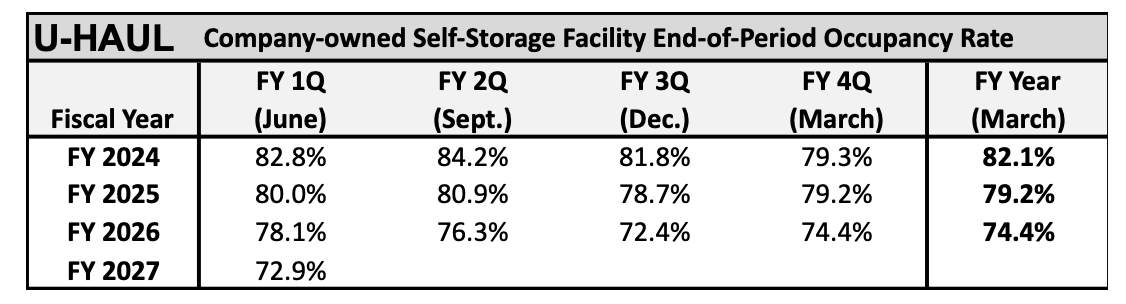
In the self-storage area, revenues increased 6.8% (or $15.9 million) as average revenue per occupied square foot improved by 6.2%. At seasoned assets, same-store revenue per foot experienced a stronger increase of 7.6%, which eliminated the short-term occupancy pressures experienced by the rollout of new property facilities. During the first fiscal quarter, the company added approximately 1.1 million net rentable square feet and 18 new locations were added and over the last 12 months, approximately 5.2 million net rentable square feet was added to the system. The average monthly occupancy rate of company-owned storage locations was 72.9%, representing a 520 basis point decline YOY. As a reminder, management purged delinquent storage room accounts during the second quarter of fiscal 2026. Approximately 12 million net rentable square feet (NRSF) of storage capacity in development or pending, down from roughly 14.8 million NRSF a year ago, which reflects management’s deliberate reduction in development spending.
Other revenue increased by 1.1% (or $1.71 million). Despite the number of moves and boxes in storage increasing, the average revenue per transaction was not as healthy. Management continues to expand the U-Box program's reach through the addition of warehouse space and storage containers. At this stage, U-Haul possesses a greater total warehouse storage footprint than it has U-Box containers to fill it.
In self-moving/self-storage products & services, revenue increased 1.1% (or $1.05 million) driven by increased sales of hitches and propane.
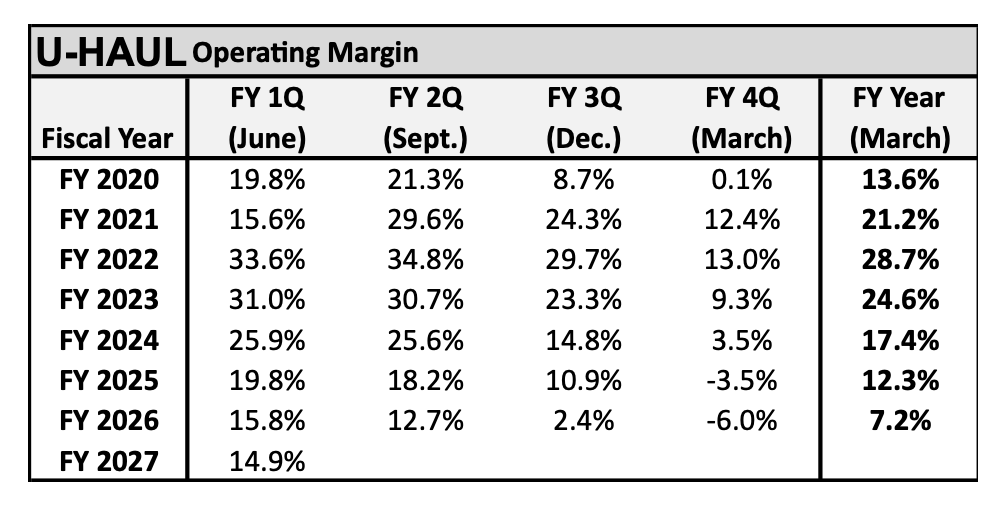
For the first quarter of FY2027, total costs and expenses increased 4.3% (or $58.4 million) to $1.43 billion. The operating margin declined89 basis points from 15.8% in 1Q FY2026 to 14.9%, which drove declines in both net income and EPS. Operating expenses (associated with self-moving equipment rentals and self-storage) increased 7.3% (or $60.2 million), driven principally by a $22.4 million increase in freight & shipping costs, a $10.2 million in increased personnel costs and a $6.2 million increase in self-insured liability costs.
Depreciation expense decreased 1.7% (or $5.17 million) on a gross basis. Depreciation expense associated with the rental fleet increased $13.5 million. Net losses from the disposal of retired rental equipment decreased by$24.0 million. On a quarterly basis, depreciation has declined sequentially in the last three quarters and should continue to trend lower over the course of fiscal 2027, since management has decided not to expand the truck fleet this fiscal year.
Capital expenditures for new rental equipment were $602 million during 1Q FY2027, a $17 million increase versus the comparable period last year. Proceeds from the sales of retired rental equipment decreased by approximately $14 million to $145 million. Net investment into the fleet was $457 million for the quarter, and management is projecting a decrease of over $500 million for net fleet investing over the next three quarters of the FY2027.
Interest expense increased 18.9%, up $15.6 million to $97.9 million due to an increase in the amount of debt outstanding. Income tax expense was $38.8 million compared with $43.1 million in the comparable quarter last year, reflecting the 27.7% decline in pretax earnings.
Earnings from operations decreased 2.6% (or $6.8 million) to $250.6 million compared to $257.4 million in the comparable quarter last year. Net income declined 13.6% to $122.9 million. Earnings per share of Voting Common Stock were $0.58 for 1Q FY2027 compared to $0.68 in 1Q FY2026. Earnings per share of Non-Voting Series N Common Stock were $0.63 per diluted share.
Note: Management utilizes the two-class method where distributed earnings (dividends) and undistributed earnings are allocated in a three-step process to each class of common stock. Our EPS calculation differs from the company's GAAP-compliant calculation in that we are attempting to illuminate the earnings power behind each voting share rather than adjust EPS for the distribution of dividends.
As of June 30, 2026, U-Haul Holding Company has a strong liquidity position in the Moving and Storage operating segment of approximately $1.348 billion (cash plus availability from existing loan facilities). Total debt in the Moving and Storage segment stood at $8.147 billion, with net debt to trailing twelve-month adjusted EBITDA of 4.4x. Working capital was approximately $4.028 billion on June 30, 2026. Moving and Storage adjusted EBITDA for the trailing twelve months ended June 30, 2026, was $1.637 billion.
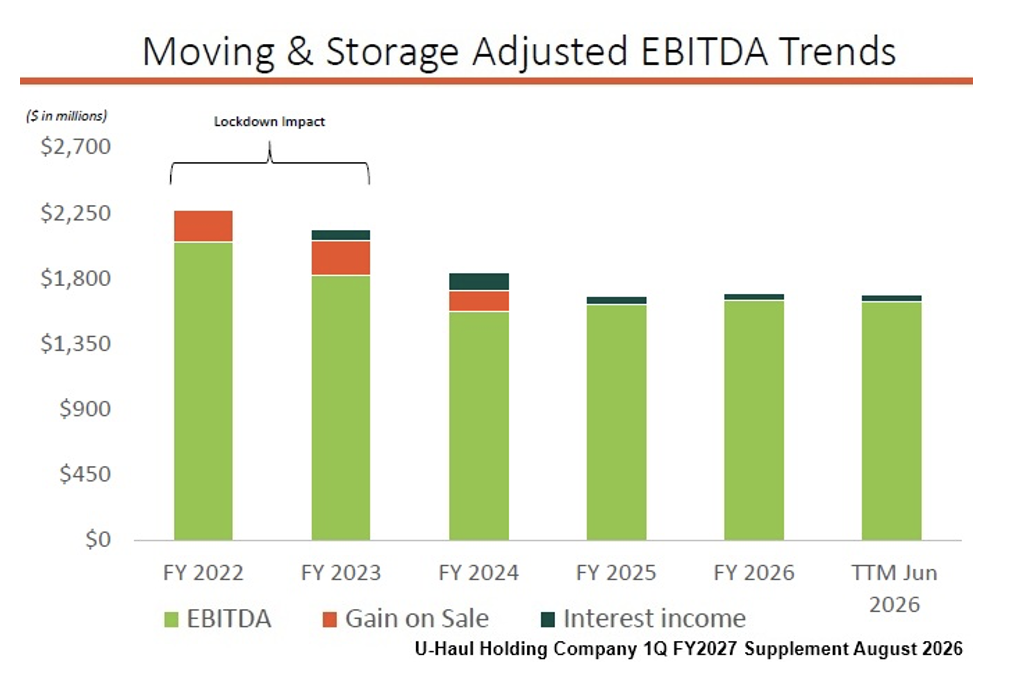
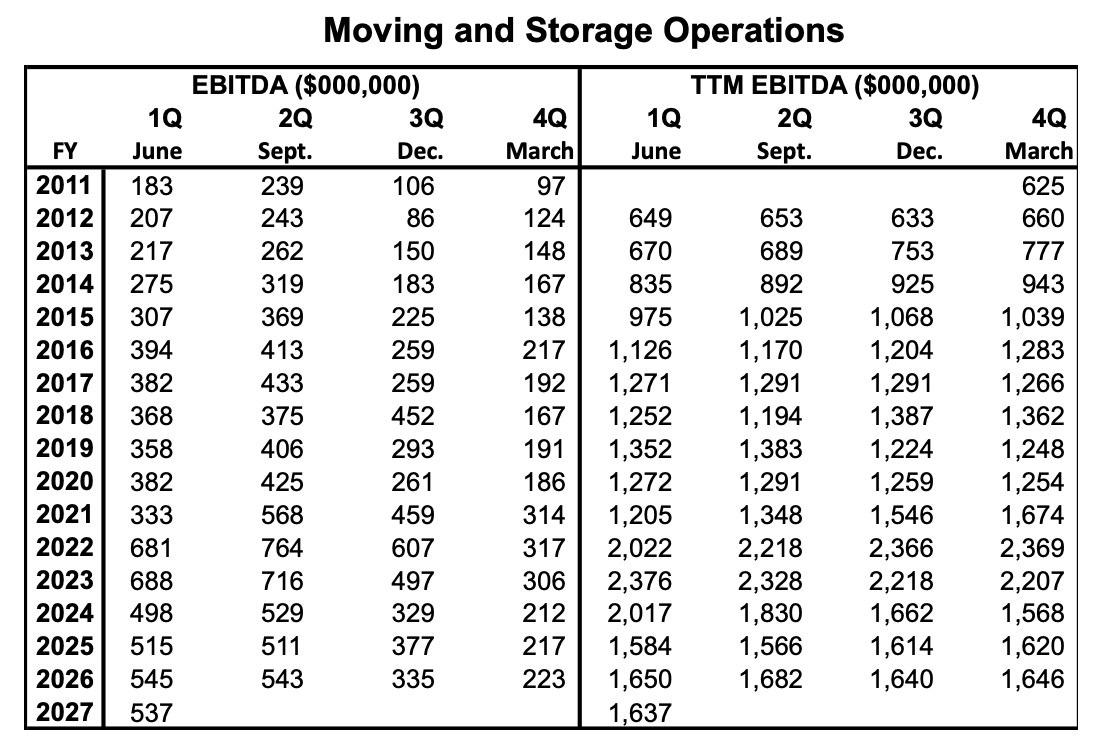
In a notable capital allocation development, on May 22, 2026, the U-Haul Holding Company Board of Directors authorized a $350 million share repurchase plan spanning both the UHAL and UHAL.B share classes. Management continues to see value in repurchasing shares at current prices. The repurchase authorization is being partially funded by a planned reduction in the growth of capital expenditures during fiscal 2027, since the expansion of the fleet over the last few years created sufficient capacity for current operations in the truck rental fleet and self-storage businesses.
During the first quarter of fiscal 2027, the company deployed a total of $48 million toward the buyback, repurchasing 248,368 shares of Voting common stock (at a cost of $15.6 million) and 584,278 shares of Non-Voting Series N stock (at a cost of $32.4 million). Subsequent to the quarter-end (June 30, 2026), the program shifted allocations toward the Non-Voting shares by acquiring an additional 149,747 Voting shares and 813,211 Non-Voting shares. As of August 2026, the maximum remaining amount authorized for future repurchases stands at slightly below $242 million.
By expecting the high EV-to-EBITDA valuation metric to be 12.0 at some point during the next 12 months, a target price of $74.00 is indicated.
SUBSCRIBE TO ZACKS SMALL CAP RESEARCH to receive our articles and reports emailed directly to you. Please visit our website for additional information on Zacks SCR.
DISCLOSURE: Zacks SCR has received compensation from the issuer directly, from an investment manager, or from an investor relations consulting firm, engaged by the issuer, for providing research coverage for a period of no less than one year. Research articles, as seen here, are part of the service Zacks SCR provides and Zacks SCR receives payments totaling a maximum fee of up to $50,000 annually for these services provided to or regarding the issuer. Full Disclaimer HERE.