By Steven Ralston, CFA
NYSE:UHAL
READ THE FULL UHAL RESEARCH REPORT
EXECUTIVE SUMMARY
U-Haul Holding Company (NYSE:UHAL) reported 3Q FY2026 results on February 4th after the close. Total revenuesincreased 1.9% to approximately $1.416 billion. The primary segment driver of the revenue increase was the 7.9% increasein the self-storage business. Self-moving equipment rental revenues increased only 0.9%, primarily from in-town rentals. Other revenues (which are predominantly driven by U-Box) decreased 0.5%, since U-Box is more dependent on demand for One-Way moves than In-Town rentals. Historically, the third fiscal quarter is seasonally the second weakest, accounting for only 23.5% of the company’s annual revenues.
Again, the bottom line was very much impacted by higher depreciation expense from newly purchased vehicles, retired cargo vans being sold at lower than estimated resale values, and also adjustments (increases) to depreciation due to the expectation of realizing lower resale prices in the used market in the future, particularly for the shorter-lived ( about two years) pickup trucks and cargo vans. The company estimates that these three factors negatively impacted EPS in the third fiscal quarter by $0.24, of which over 75% was related to the cargo van fleet. A section titled “The Depreciation Conundrum” has been added to this report in order clearly and coherently explain the depreciation predicament that is affecting U-Haul’s profitability in the current phase of the fleet rotation program.
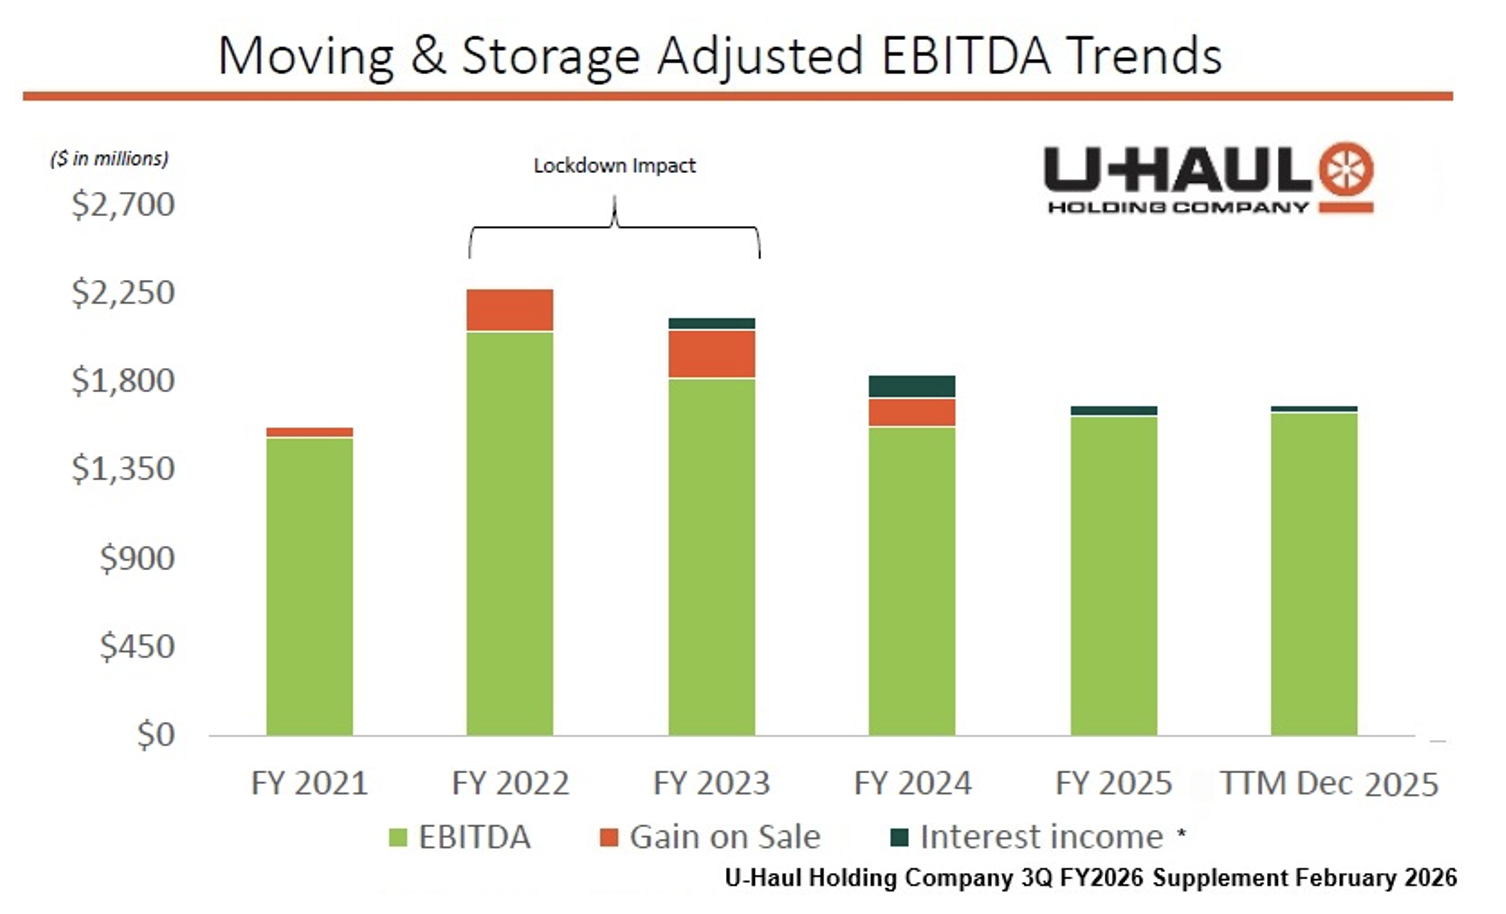
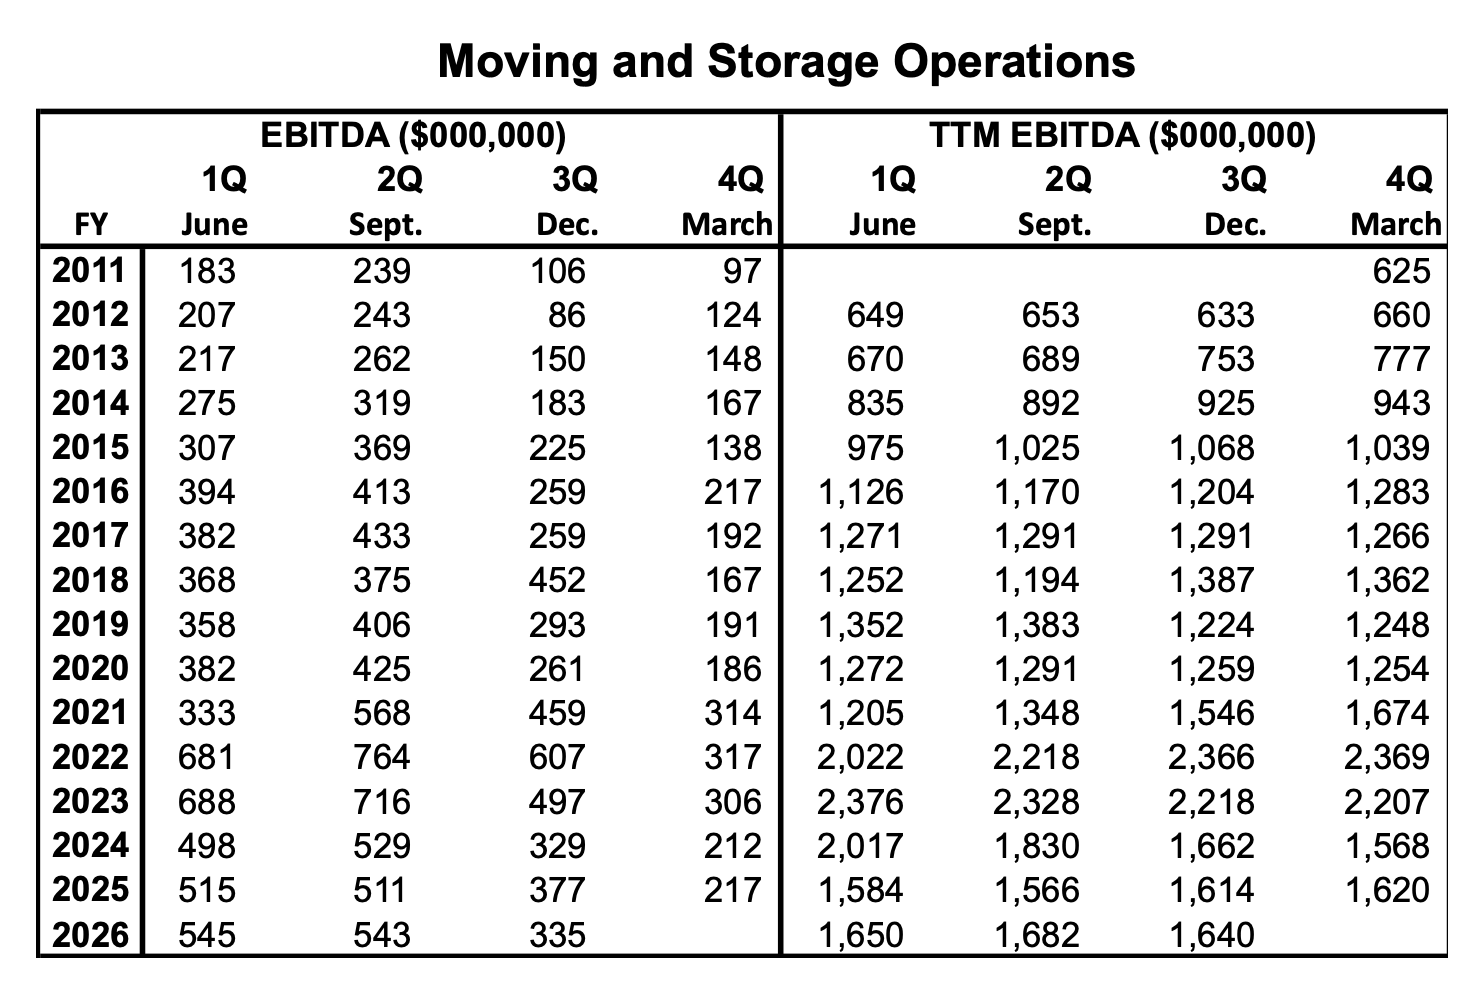
During this period of revitalizing the company’s fleet, a more valid indication of U-Haul’s underlying operational strength is adjusted EBITDA, primarily generated by the company’s core business, Moving and Storage, which increased 1.6% to $1,640 million on a 12-month trailing basis. In the slide below, note the stability and strength of adjusted EBITDA, which removes the non-recurring negative effects of COVID and the EV mandates, namely revealing the effects of the inordinately high non-recurring gains & losses on sale of retired vehicles and eliminating the outsized effect of depreciation resulting from the higher pricing of ICE vehicles that affected the company’s fleet rotation program.
Management expects that depreciation expense should peak within the next 12 months, after which the next trough in depreciation should be in the $700-$750 million range on an annual basis. At that time, given a healthy self-moving environment, U-Haul’s EPS will once again properly reflect the company’s earnings power. Currently, EPS are a reflection of the company’s position in its self-moving equipment capex cycle. In the meantime, adjusted EBITDAis a better gauge of U-Haul’s underlying operational strength.
As a result of trying to catch up on the company’s fleet rotation program over the past two years, U-Haul is slightly over-fleeted. Since December 2024, the truck fleet has increased by almost 11,000 units, mostly 10-foot trucks. Management has decided to take advantage of the temporary surplus inventory of rental vehicles as an opportunity to grow the company’s dealer network and expand market penetration, which is expected to improve the company’s long-term competitive position. Excess inventory of rental vehicles has been allocated to new dealers. In the past, U-Haul operated with such a degree of tight fleet management that adding new dealers would have reduced the availability of equipment at existing locations. Using a data-driven approach, management is targeting specific markets that are currently underserved by the company. As a corollary to the depreciation dilemma and being slightly over-fleeted, management has decided to reduce new truck purchases by over $500 million in fiscal 2027.
To illustrate the scale of the expansion of the dealer network initiative, the 5-year CAGR of the dealer network has been 1.6%, but over a 12-month period, it is estimated that U-Haul’s network will grow by at least 5%. Year-over-year, the number of locations has increased by 430 (65 company-operated and 365 independent dealers). Already, the dealer network totals over 25,000 locations, a record high for the company. Measurable increases in transaction volume and revenue from the initiative are expected to appear in the fourth quarter of fiscal 2026 (April-June 2026). Through the dealer network initiative, U-Haul’s long-term competitive position is being advanced by increasing the number of dealer locations, particularly in underserved markets, and by enhancing customer convenience.
FINANCIAL RESULTS FOR THE THIRD QUARTER OF FISCAL 2026
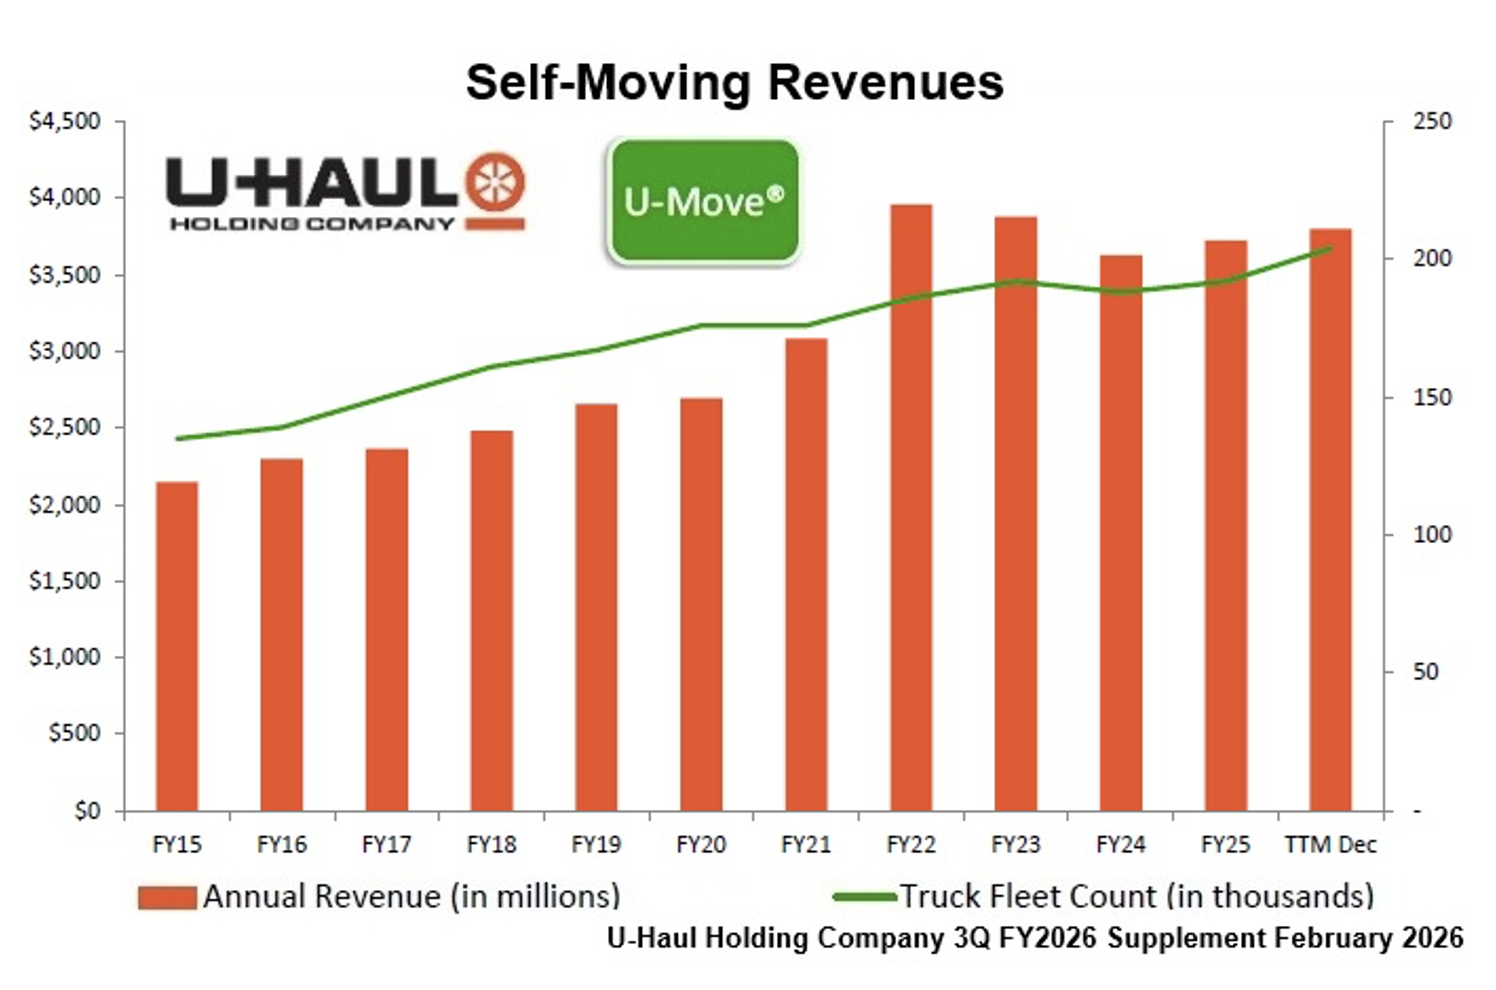
On February 4, 2026, after the market close, U-Haul Holding Company reported financial results for the third fiscal quarter ending December 31, 2025. Total revenuesincreased 1.9% YOY (or $27.05 million) to approximately $1.416 billion. The primary segment driver of the revenue increase was the 7.9% increase (or $17.9 million) in the self-storage business. Self-moving equipment rental revenues increased only 0.9% (or $7.6 million) compared to the third quarter of fiscal 2025, primarily from In-Town rentals. Other revenues (which are predominantly driven by U-Box) decreased 0.5% (or $0.6 million), primarily since the U-Box is more dependent on demand for One-Way moves than In-Town rentals. The third fiscal quarter is seasonally the second weakest, historically accounting for only 23.5% of annual revenues.
In the self-moving equipment rental business, revenues increased 0.9% (or $7.6 million) as In-Town transactions increased during the quarter, while One-Way move transactions were pressured by consumers shortening the distance of their moves amid economic uncertainty. Compared to the same period last year, U-Haul increased the number of company-operated retail locations by 65 and had a net increase of 365 independent dealers, while the number of box trucks in the rental fleet increased by nearly 11,000 units.
In self-moving/self-storage products & services, revenue decreased 2.1% (or $1.48 million) due to lower sales of hitches and propane.
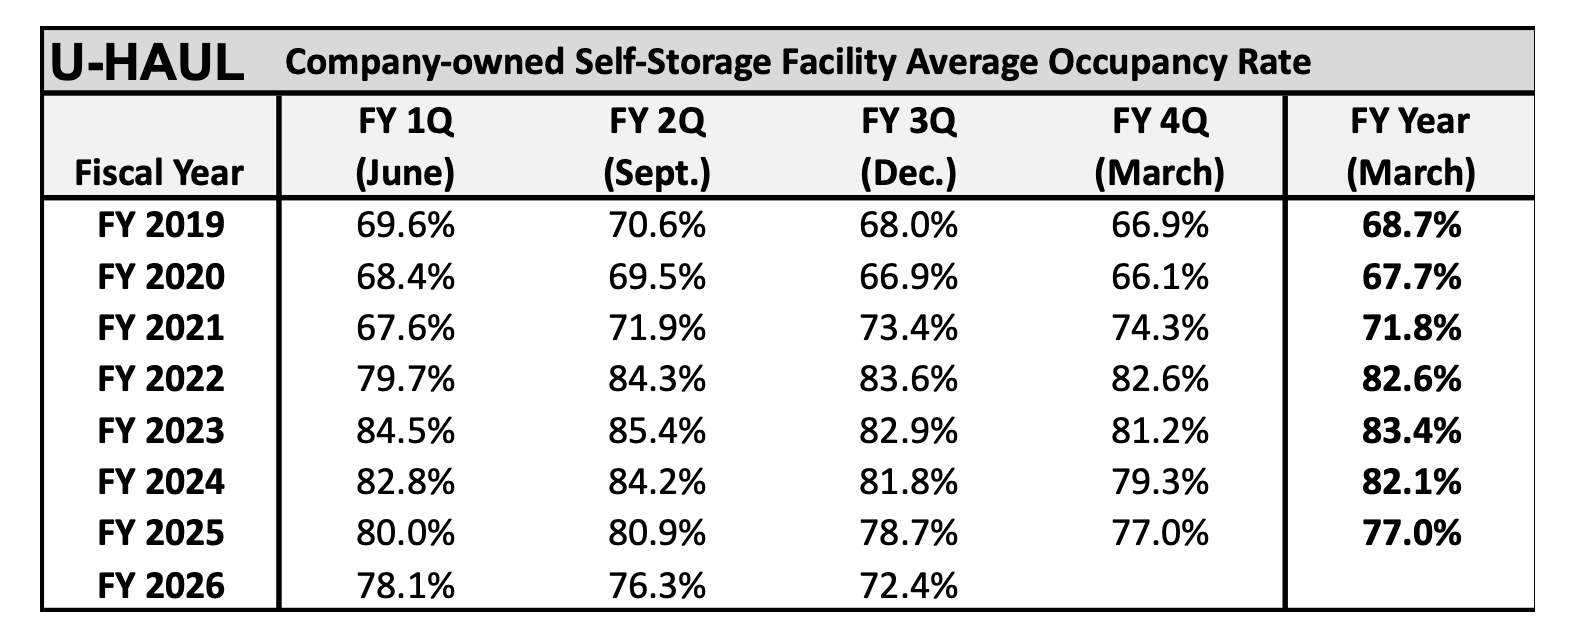
In the self-storage area, revenues increased 7.9% (or $17.9 million) as the portfolio benefited from a 6.7% improvement in average revenue per occupied foot and capacity additions (approximately 1.5 million new net rentable square feet and 16 new locations). Over the last 12 months, approximately 5.9 million net rentable square feet were added (0.8 million acquired, 5.1 million from new development).
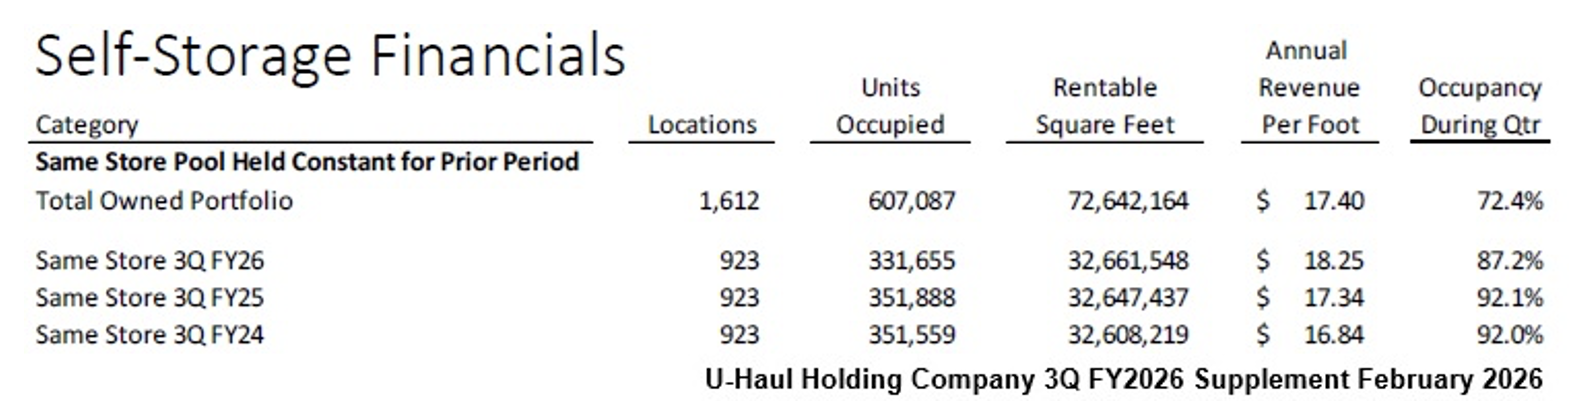
Same-store occupancy decreased 490 basis points to 87.2%, though approximately 400 of those basis points were attributable to the system-wide initiative to address delinquent storage units (which does not affect revenue since storage revenue is recorded upon collection).
In July 2025, management implemented an operational initiative to address delinquent accounts across the self-storage portfolio. The initiative created short-term headwinds for occupancy metrics, but it is designed to seize the opportunity to replace non-revenue occupancy with revenue-generating capacity. The removal of delinquent tenants was completed by October 2025. Management was cognizant that executing the initiative during the seasonally weak fall months would be challenging, but self-storage will be poised to benefit in the peak season during the spring of 2026. However, it is interesting that self-storage revenues increased 9.7% in the second fiscal quarter and 7.9% in the third fiscal quarter, hinting that this initiative is already gaining traction. Management’s pragmatic focus on revenue rather than short-term quarterly occupancy rates demonstrates the prioritization of long-term economic value over short-term metrics.
The average revenue per occupied foot on the same-store pool was $18.25 on a trailing 12-month basis (and $17.40 on the total owned portfolio, which had a 72.4% occupancy rate). Management continues its pricing strategy of straightforward rates and avoiding the large introductory discounts that are prevalent among competitors in the industry.
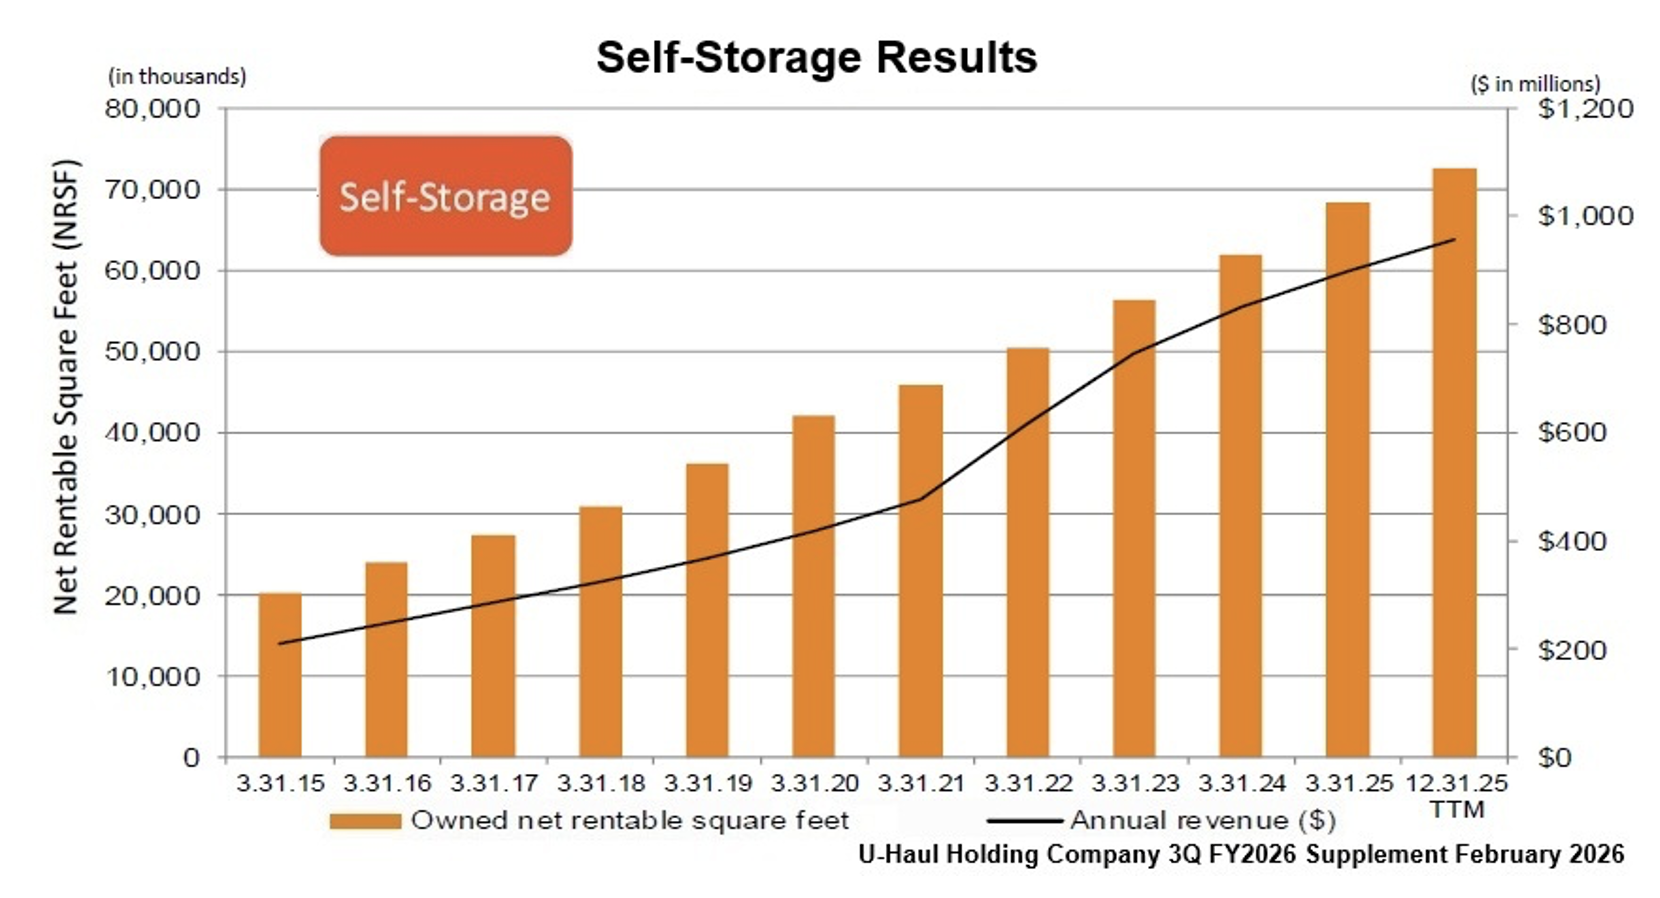
The self-storage portfolio consists of 2,101 locations (1,612 owned) encompassing 97.9 million net rentable square feet (NRSF), of which 72.6 million NRSF are owned. 106 self-storage projects are in development, which represents approximately 5.7 million NRSF. Another 7.1 million NRSF are in projects that are pending (where the real estate is owned but development has not yet started).
Other revenuedecreased 0.5% (or $0.6 million) compared to the prior year quarter, primarily due to decreases in the U-Box program. Nevertheless, management continues to expand the breadth and reach of the U-Box program through the addition of warehouse space, moving and storage containers, and delivery equipment. U-Haul now has a U-Box presence at over 700 locations in North America with more than 200,000 U-Box containers in service, of which over 100,000 are in the hands of customers. The U-Box business operates primarily in long-distance moving transactions, a segment that faced pressure during the third fiscal quarter as consumers have shifted toward shorter-distance moves.
Total operating costs and expenses increased by 11.6% (or $144.1 million), primarily due to a $79.1 million increase in depreciation net of (gains) losses on disposals and a $66.6 million increase in operating expenses at Moving and Storage. The primary drivers of operating expense increases were liability costs (a $37.9 million increase predominantly from reserve strengthening), personnel costs (a $16.2 million increase), and fleet repair & maintenance costs (a $13.1 million increase). U-Haul Holding Company continues to absorb elevated self-insurance reserve strengthening as the company has increased its self-insurance liability by nearly $79 million since March 2025.
Total depreciation expense (net of disposal gains/losses) increased 32.2% (or $79.1 million) to $325.2 million, as rental fleet depreciation increased $44.8 million due to an increased number of box trucks in the fleet combined with expected decreases in resale values for certain units. Net losses from disposal of rental equipment were $26.2 million compared to a gain of $3.8 million in the comparable prior-year quarter, which is a $29.8 million adverse swing. Cargo vans purchased in model years 2023 and 2024 came into the fleet at elevated post-COVID acquisition prices, while current used-vehicle resale values have declined as the marketplace adjusts to OEM manufacturers’ more normalized new vehicle pricing. Pickup trucks and cargo vans are the most short-lived vehicle assets (roughly two years), and therefore, their depreciation numbers are being adjusted every quarter. With cargo vans being priced approximately 20% lower than two years ago, the loss on disposal and the forward-looking adjustment of depreciation, the vans are accounting for over 75% of the combined fleet YOY depreciation and disposal loss variance of $74.6 million (-$0.18 per Non-Voting share). Depreciation expense from real estate increased $5.04 million.
Earnings from operations declined 77.7% (or by $117.1 million) to $33.7 million compared to $150.7 million in the third quarter of fiscal 2025. In the company’s core businesses, Moving and Storage, adjusted EBITDA decreased 11.1% (or $41.7 million) to $335.0 million for the quarter.
On a trailing 12-month basis, Moving and Storage’s adjusted EBITDA was $1.640 billion, a $26.0 million improvement over the prior trailing-twelve-month period, demonstrating the underlying earnings power of the business. As management continues to reinvest for growth through capital expenditures, depreciation is temporarily masking the company’s earnings power.
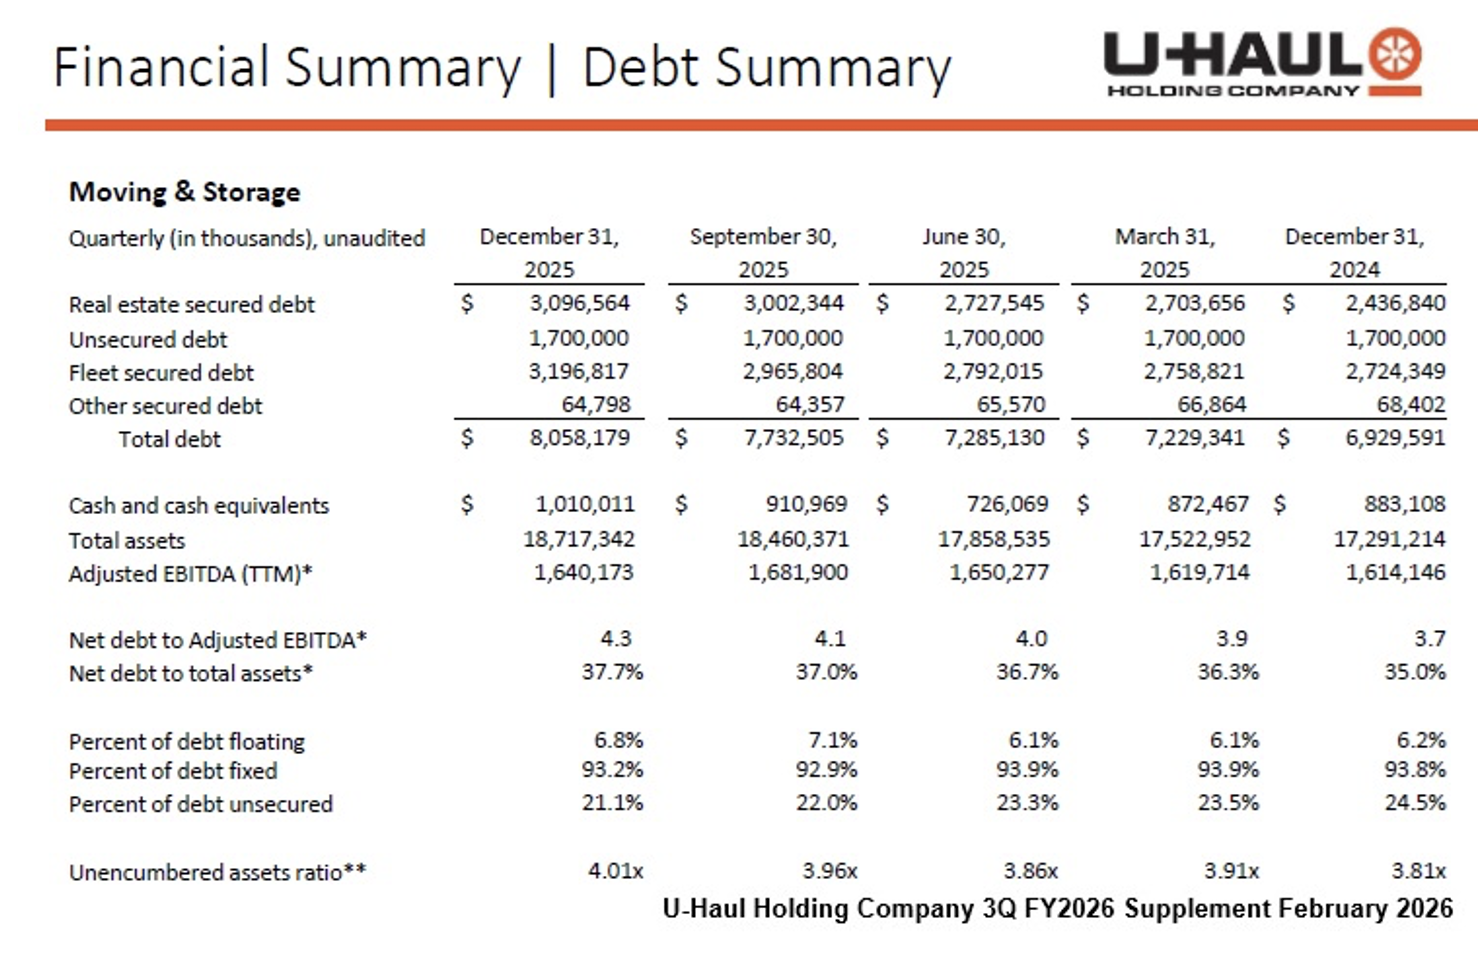
Interest expense for the third quarter of fiscal 2026 was $95.5 million compared with $76.6 million for the third quarter of fiscal 2025, reflecting an increase in the amount of outstanding debt and an increase in the average cost of debt. Total Moving and Storage debt stood at $8.058 billion as of December 31, 2025 (compared with $6.930 billion a year earlier), reflecting continued fleet and real estate investment. Net debt to trailing 12-month adjusted EBITDA increased to 4.3x from 3.7x a year earlier. The percent of debt at fixed rates was 93.2%, providing significant insulation from interest rate volatility. The unencumbered asset ratio was 4.01x, well above the minimum covenant requirement of 2.0x.
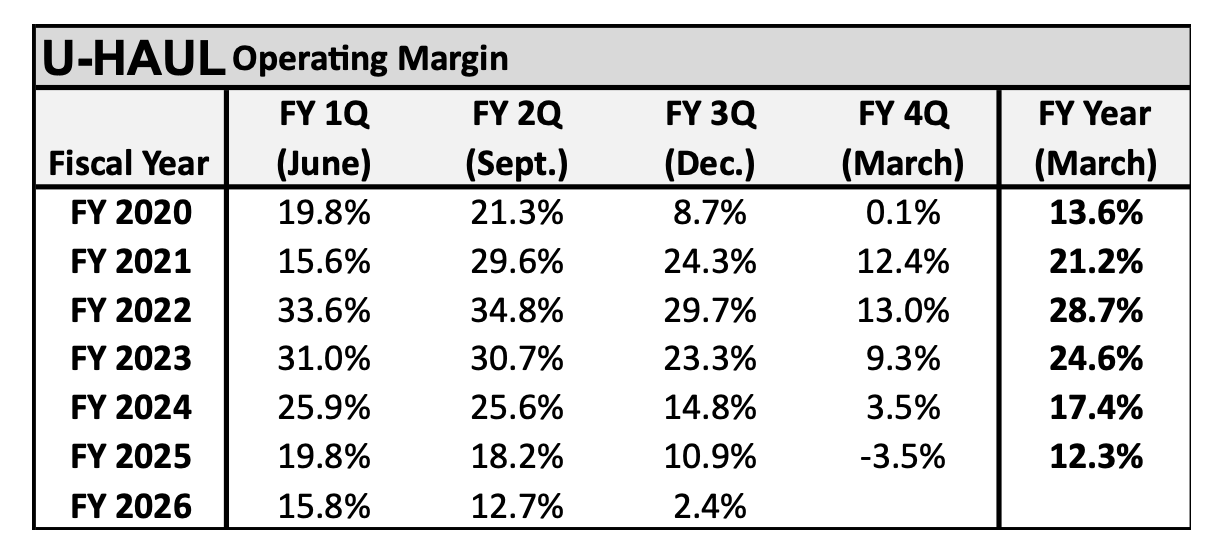
Despite total revenues increasing 1.9%, total operating expenses increased 11.6%, resulting in an 848 bps decline in the operating margin, which accounted for the reduced earnings from operations. The major source of increased operating expenses was depreciation.
For the third quarter of fiscal 2026, U-Haul Holding Company reported a net loss of $37.0 million or -$0.18 per Non-Voting share (UHAL.B) and -$0.23 per Voting share (UHAL) compared to net earnings of $67.2 million (or $0.35 per Non-Voting share and $0.30 per Voting share) in the comparable quarter last year. Shares outstanding have remained stable at 19,607,788 voting shares and 176,470,092 non-voting shares since fiscal 2020.
Note: Management utilizes the two-class method, where distributed earnings (dividends) and undistributed earnings are allocated in a three-step process to each class of common stock.
As of December 31, 2025, U-Haul Holding Company has a strong liquidity position. The Moving and Storage operating segment has approximately $1.475 billion of cash and available credit (compared to $1.376 billion at September 30, 2025). Total consolidated cash and cash equivalents were $1.032 billion. Working capital was approximately $4.625 billion on December 31, 2025.
THE DEPRECIATION CONUNDRUM
Management is addressing depreciation challenges stemming from an unprecedented dilemma that affected the fleet rotation program. Two extraordinary macro disruptions affected the commercial vehicle market over the last several years. The COVID-19 pandemic severely disrupted automotive supply chains and created widespread vehicle shortages. This was compounded by a pronounced political and regulatory influence toward the adoption of electric vehicles (EVs). The major original equipment manufacturers (OEMs), notably General Motors and Ford, sharply reduced investments into internal combustion engine (ICE) vehicle production. For example, Mary Barra (CEO of GM) publicly declared that the company would cease making ICE vehicles after 2037. Ford redirected capital allocation away from ICE vehicles, which included eliminating the second shift at one of its key truck plants that U-Haul had relied upon as a supplier for over a decade. Furthermore, the OEMs raised prices, in some cases by 30% to 50%, along with imposing allocation constraints. As a result of these supply chain disruptions, U-Haul could no longer freely purchase the models and quantities required to seamlessly execute its fleet rotation program but instead had to accept whatever the disrupted supply chain could produce.
Faced with the prospect of a future in which ICE vehicles might become increasingly scarce, management purchased supply became available in order to replace its aging fleet, even though vehicle prices were inflated and the mix would not be optimal. As a result, U-Haul became slightly over-fleeted at inflated acquisition costs, which are embedded in the asset base.
The depreciation problem has two distinct but related dimensions. First, the box truck fleet has expanded by nearly 11,000 units compared to December 2024. Since box trucks are depreciated on a declining-balance schedule (16% of cost in year 1, 13% in year 2, etc.), the pace of the addition of new vehicles creates proportionally higher depreciation charges each period if continuous large purchases are completed. Management is addressing this issue by reducing the level of new truck purchases by over $500 million in fiscal 2027.
There is also some evidence that the peak in depreciation expense is occurring. Though it is counterintuitive, despite depreciation being dramatically higher year-over-year in the third fiscal quarter of 2026, it declined modestly on a sequential basis from the second fiscal quarter of 2026. The sequential decline reflects a step-down mechanism as box trucks pass their yearly anniversaries when the annual depreciation rate applied to each unit automatically decreases. Therefore, absent continuous large purchases, the aggregate depreciation charge on the box truck fleet will drift downward.
Second, an acutely damaging depreciation dimension involves the cargo van and pickup truck fleet. These are shorter-lived assets that U-Haul turns over more frequently than box trucks, making them sensitive to resale market conditions. The 2023 model year vans and pickups (that were purchased at elevated post-COVID prices) began cycling out of the fleet during fiscal 2026 and have been generating losses on disposal since current used-vehicle resale values have dropped dramatically relative to the elevated acquisition costs. During the third fiscal quarter, U-Haul reported a net loss on disposal of retired rental equipment of $26.2 million, compared to a net gain of $3.8 million in the same quarter of the prior year, a $30 million swing. The underlying reason is that OEMs have moved away from EV mandates and now are selling new ICE vehicles at lower prices while still being able to maintain profitability margins. When new vehicle prices decline, used vehicle prices follow. As a result, residual values of U-Haul's van and pickup fleets have been compressed to levels lower than initially estimated.
In response to deteriorating resale values, U-Haul accelerated the pace of depreciation on the cargo van and pickup fleet, which is calculated on a quarter-to-quarter basis. By adjusting rates dynamically as new information about the used-vehicle market becomes available, the company is attempting to set depreciation levels so that by the time a vehicle is sold, the book value is approximately neutral to the sale price, effectively smoothing the economic loss through the income statement rather than recognizing large, lumpy loss-on-disposals at the time of sale. About 6,000 2024 vans are not yet fully marked to market through this adjusted depreciation process. The resulting effect will be to expect either higher than expected depreciation expense in the interim and/or additional losses on sale when those units are retired.
The combined financial impact of depreciation and accounting for disposals on the third quarter of fiscal 2026 significantly impacted reported EPS. Total depreciation expense on rental equipment was $222.7 million, up $44.8 million from the comparable quarter in the prior fiscal year. Adding the $26.2 million net loss on disposal of rental equipment, the total depreciation and disposal charge was $248.9 millionversus a combined charge of approximately $174.2 million (last year, disposals generated a gain rather than a loss). The aggregate fleet depreciation and disposal impact was a $74.6 million increase versus the prior fiscal year's third quarter, with over 75% of the negative variance derived from the cargo van fleet. Depreciation and disposals negatively affected EPS by $0.24, which is about half of the year-over-year swing in EPS, making it the single largest driver of the quarter's loss.
On the box truck side, the fleet mix remains imperfect, particularly in the 20-foot truck cohort, which contains a disproportionate number of units that are 8- to 10-years-old. At some point, new purchases of that size will be needed to smooth the age distribution. Management indicated that approximately 12,000 20-foot trucks need to rotate through the resale market over at least a 3-year period.
Concerning cargo vans, 2026 model purchases are coming onto the books at an average cost approximately 12% lower than the 2025 model and about 20% lower than the 2024 model. Therefore, the replacement cargo vans that enter the fleet will have a structurally lower depreciation base, which will gradually reduce the per-unit depreciation burden as the expensive 2024 cohort is retired.
During the calendar year 2025, the gross fleet spend was approximately $2.025 billion. The initial gross budget for new truck purchases in fiscal 2027 is over $500 million less, which will significantly reduce the amount of fleet assets entering the depreciation base.
Looking forward into fiscal 2027, the combination of lower incoming vehicle acquisition costs, a reduced budget for new truck purchases, and the eventual clearing of the expensive 2024 cargo van cohort should eliminate, or certainly reduce, the depreciation and vehicle retirement/ resale-loss overhang that has been masking U-Haul’s earnings power that first appeared in fiscal 2024. However, the fleet imbalance, particularly for box trucks, still needs to be resolved, and management acknowledges it will be a multi-year process to properly rebalance the truck fleet across sizes and ages.
By expecting the high EV-to-EBITDA valuation metric to be 10.8 at some point during the next 12 months, a target price of $60.90 is indicated.
SUBSCRIBE TO ZACKS SMALL CAP RESEARCH to receive our articles and reports emailed directly to you each morning. Please visit our website for additional information on Zacks SCR.
DISCLOSURE: Zacks SCR has received compensation from the issuer directly, from an investment manager, or from an investor relations consulting firm, engaged by the issuer, for providing research coverage for a period of no less than one year. Research articles, as seen here, are part of the service Zacks SCR provides and Zacks SCR receives payments totaling a maximum fee of up to $50,000 annually for these services provided to or regarding the issuer. Full Disclaimer HERE.